Trends for population growth and races for the different states within the USA.
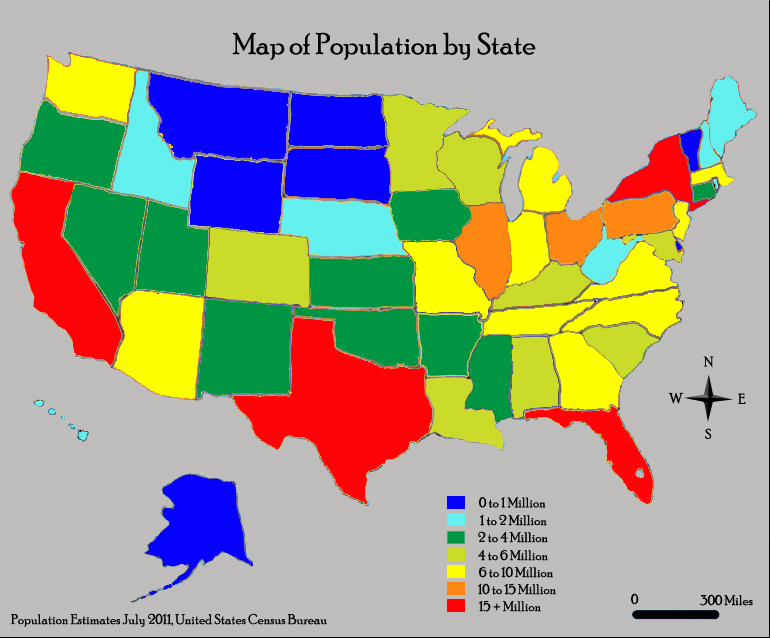
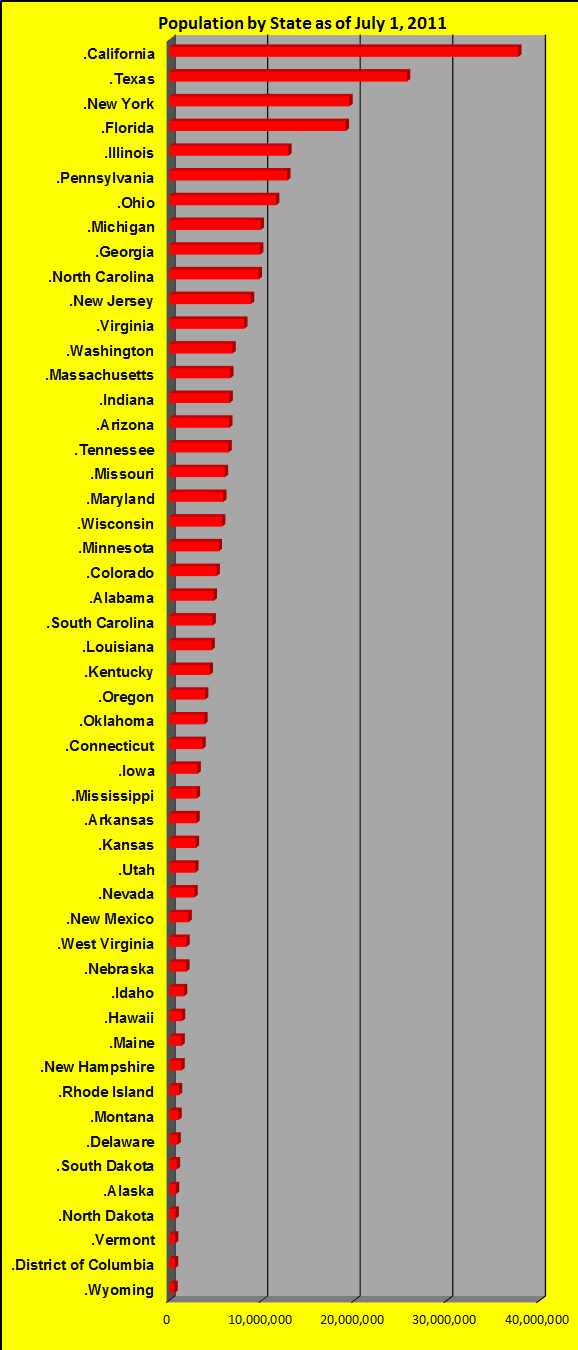
Population within the United States has been growing at various rates for different time periods depending on the particular state for a variety of reasons. Listed below is a population map and bar chart for July 1, 2011. The chart below shows the population for each state as of July 1, 2000 and July 1, 2011 for comparisons of growth for the different states. The state with the largest population is California, however over that 11 year time period Texas experienced the greatest growth in shear numbers of people living in the United States with a growth of 4,728,718 persons. By clicking on the state you will find a graphs showing trends of population growth and the United States for the years from 2000 to 2012.

State populations for years 2000, 2011 and 2018, in alphabetical order. Percentage growth is shown to the right.
|
The bar chart of states represents the order of greatest to least populated states. The chart also shows how close New York and Florida are for being the state with the 3rd largest population.
|
||||||||||||||||||||||||||||||||||||||||||||||||||||||||||||||||||||||||||||||||||||||||||||||||||||||||||||||||||||||||||||||||||||||||||||||||||||||||||||||||||||||||||||||||||||||||||||||||||||||||||||||||||||||||||||||||||||||||||||||||||||||||||||||||||||||||||||||||||||||||||||||||||||||||||||||||||||||||||||||||||||||||||||||||||||||||||||||||||||||||||||||||||||||||||||||||||||||||||||||||||||||||||||||||||||||||||||||||
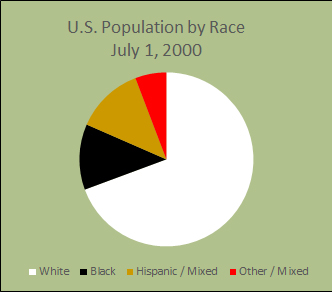
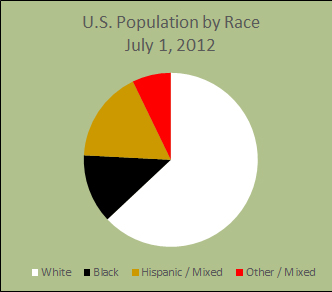
The race percentages for United States has changed some from 2000 to 2012. The percentage of the white only population has decreased from 69.4 to 63.0. The percent of the black only population has only slightly increased from 12.2 to 12.8. The percent of population of hispanics has increased from 12.6% to 17.0% and other/mixed races have increased from 5.8% to 7.2%.
Population by Race for the United States |
||||
Race |
July 1, 2000 |
% of Total |
July 1, 2012 |
% of Total |
White |
195,701,752 |
69.4 |
202,988,134 |
63.0 |
Black |
34,405,800 |
12.2 |
41,312,371 |
12.8 |
Hispanic / Mixed |
35,661,885 |
12.6 |
54,746,061 |
17.0 |
Other / Mixed |
16,392,974 |
5.8 |
23,120,578 |
7.2 |
Total Races & Hispanic* |
282,162,411** |
322,167,144** |
||
*Hispanics are technically not considered a race but rather an ethnicity.
**Note the slight difference of the population used in the race chart from population chart above. Totals were estimates from U.S. Census bureau and they had the discrepancy.


References:
Population Estimates, 2013, United States Census Bureau, http://www.census.gov/popest/data/historical/2010s/index.html
List of U.S. states and territories by population, 2013, Wikipedia The Free Encyclopedia, http://en.wikipedia.org/wiki/List_of_U.S._states_and_territories_by_population
