
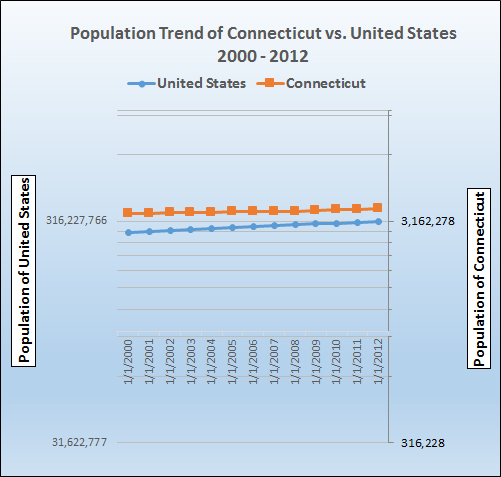
Population of Connecticut and the United States Annually from 2000 to 2012 |
|||||||||||||
Territory |
7/1/2012 |
7/1/2011 |
7/1/2010 |
7/1/2009 |
7/1/2008 |
7/1/2007 |
7/1/2006 |
7/1/2005 |
7/1/2004 |
7/1/2003 |
7/1/2002 |
7/1/2001 |
7/1/2000 |
United States |
313,914,040 |
311,591,917 |
309,330,219 |
307,006,550 |
304,374,846 |
301,579,895 |
298,593,212 |
295,753,151 |
293,045,739 |
290,326,418 |
287,803,914 |
285,081,556 |
282,171,957 |
Connecticut |
3,590,347 |
3,580,709 |
3,575,498 |
3,518,288 |
3,502,932 |
3,488,633 |
3,485,162 |
3,477,416 |
3,474,610 |
3,467,673 |
3,448,382 |
3,428,433 |
3,411,726 |
Annual Estimates and data of the Resident Population for the United States and States: April 1, 2000 to July 1, 2009 (NST-EST2009-01)
Source: U.S. Census Bureau, Population Division
Release Date: December 2009
Annual Estimates of the Population for the United States and States: April 1, 2010 to July 1, 2011 (NST-EST2011-01)
Source: U.S. Census Bureau, Population Division
Release Date: December 2011
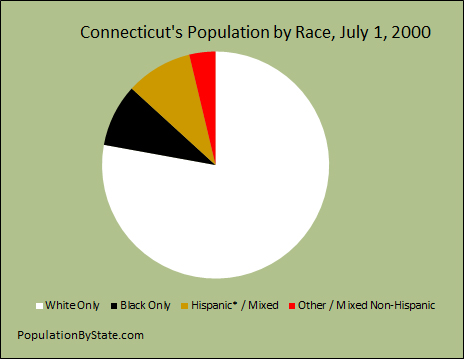
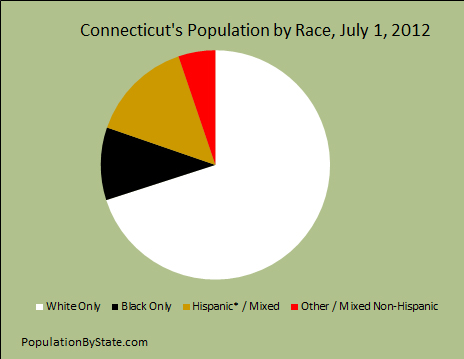
The race percentages for Connecticut are shown with the table and charts below that indicate there have been changes from 2000 to 2012. The percentage of the population of white only has decreased from 77.9 to 70.0. The percent of the black only population has increased from 8.9 to 10.3. The percent of population of hispanic / mixed has increased from 9.5% to 14.5% and other/mixed races have increased from 3.7% to 5.2%.
Population by Race for Connecticut |
||||
| Race | July 1, 2000 |
% of Total |
July 1, 2012 |
% of Total |
| White Only | 2,656,149 |
77.9 |
2,571,594 |
70.0 |
| Black Only | 304,268 |
8.9 |
376,620 |
10.3 |
| Hispanic* / Mixed | 323,852 |
9.5 |
531,832 |
14.5 |
| Other / Mixed Non-Hispanic | 127,508 |
3.7 |
191,762 |
5.2 |
| Total Races with Hispanic* | 3,411,777** |
100.00 |
3,671,808** |
100.0 |
*Hispanics are technically not considered a race but rather an ethnicity.
**Note the slight difference of the population used in race chart from population chart above. Totals were taken from U.S. Census bureau which contained differences for their total population tables for the states and it's tables for the population totals for the state with the breakdowns of the races.
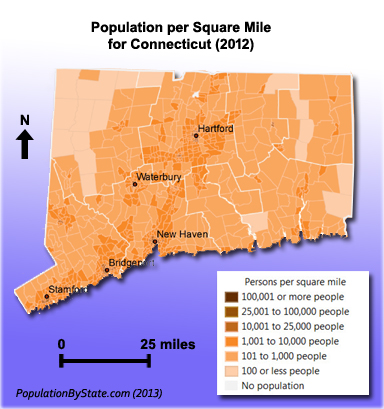
Population Density Map of Connecticut by Square Mile
Darker orange color indicates areas of higher population density. Map is delineated by county.
Counties with major cities in general contain segments of higher population.
References:
Population Estimates, 2013, United States Census Bureau, http://www.census.gov/popest/data/historical/2010s/index.html
List of U.S. states and territories by population, 2013, Wikipedia The Free Encyclopedia, http://en.wikipedia.org/wiki/List_of_U.S._states_and_territories_by_population
U.S. Population Density, ArcGis, http://www.arcgis.com/home/item.html?id=302d4e6025ef41fa8d3525b7fc31963a