
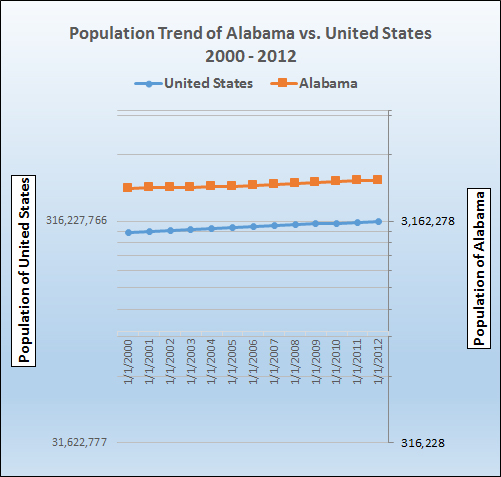
The population of Alabama went from 4,451,849 to 4,822,023 from 2000 to 2012 for a total growth of 370,174. The population of the United States for that same time period went from 282,171,957 to 313,914,040 for a total population growth of 31,742,083. Alabama had a total percentage growth for those 12 years of 8.3 percent which was slower than the overall United States total percentage growth which was 11.2 over those same years. The trends of growth for both the United States and Alabama can be seen on the graph below. The graph which is logarithmic indicates that although the growth was slower for Alabama than the United States the trends were similar.
Population of Alabama and the United States Annually from 2000 to 2012 |
|||||||||||||
| Territory | 7/1/2012 |
7/1/2011 |
7/1/2010 |
7/1/2009 |
7/1/2008 |
7/1/2007 |
7/1/2006 |
7/1/2005 |
7/1/2004 |
7/1/2003 |
7/1/2002 |
7/1/2001 |
7/1/2000 |
| United States | 313,914,040 |
311,591,917 |
309,330,219 |
307,006,550 |
304,374,846 |
301,579,895 |
298,593,212 |
295,753,151 |
293,045,739 |
290,326,418 |
287,803,914 |
285,081,556 |
282,171,957 |
| Alabama | 4,822,023 |
4,802,740 |
4,785,401 |
4,708,708 |
4,677,464 |
4,637,904 |
4,597,688 |
4,545,049 |
4,512,190 |
4,490,591 |
4,472,420 |
4,464,034 |
4,451,849 |
Annual Estimates and data of the Resident Population for the United States and States: April 1, 2000 to July 1, 2009 (NST-EST2009-01)
Source: U.S. Census Bureau, Population Division
Release Date: December 2009
Annual Estimates of the Population for the United States and States: April 1, 2010 to July 1, 2011 (NST-EST2011-01)
Source: U.S. Census Bureau, Population Division
Release Date: December 2011
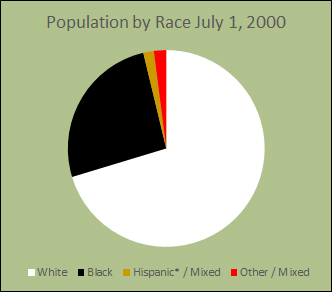
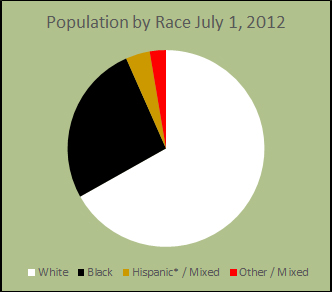
The race percentages for Alabama have changed some from 2000 to 2012. The percentage of the population of white only has decreased from 70.6 to 67.4. The percent of the black only population has only slightly decreased from 25.6 to 25.5. The percent of population of hispanics has increased from 1.7% to 4.0% and other/mixed races have increased from 2.0% to 2.7%.
Population by Race for Alabama |
||||
Race |
July 1, 2000 |
% of Total |
July 1, 2012 |
% of Total |
White Only |
3,131,028 |
70.6 |
3,267,164 |
67.4 |
Black Only |
1,154,109 |
25.6 |
1,295,698 |
25.5 |
Hispanic* / Mixed |
77,016 |
1.7 |
193,868 |
4.0 |
Other / Mixed |
90,020 |
2.0 |
130,006 |
2.7 |
Total Races with Hispanic* |
4,452,173** |
4,886,736** |
||
*Hispanics are technically not considered a race but rather an ethnicity.
**Note the slight difference of the population used in race chart from population chart above. Totals were taken from U.S. Census bureau which contained differences for their total population tables for the states and tables for the population totals for the state with the breakdowns of the races.
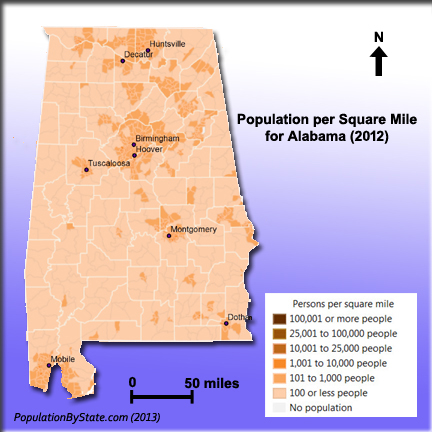
Population Density Map of Alabama by Square Mile
Darker orange color indicates areas of higher population density. Map is delineated by county.
Counties with major cities in general contain segments of higher population.
References:
Population Estimates, 2013, United States Census Bureau, http://www.census.gov/popest/data/historical/2010s/index.html
List of U.S. states and territories by population, 2013, Wikipedia The Free Encyclopedia, http://en.wikipedia.org/wiki/List_of_U.S._states_and_territories_by_population
U.S. Population Density, ArcGis, http://www.arcgis.com/home/item.html?id=302d4e6025ef41fa8d3525b7fc31963a